
Thinkmap animates and visualizes information, enabling you to navigate through data and gain insight through exploration. With Thinkmap, you find relationships you didn't know exist and see hidden patterns from large data sets.
The Thinkmap SDK (Software Development Kit) enables developers to quickly create visualizations of many different types of information. Because the SDK offers a combination of ease-of-use and flexibility, a developer can create rapid prototypes and work in an iterative process to develop applications.
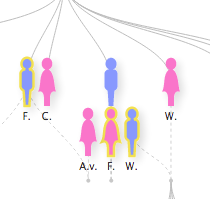
One of Thinkmap's strengths is its ability to show the same information in multiple contexts, shifting seamlessly between different views. In this example, Thinkmap is used to navigate through the family tree of the Royal Family of Europe. The user can view the information as a family tree or as a timeline with swimlanes.
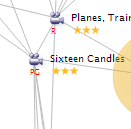
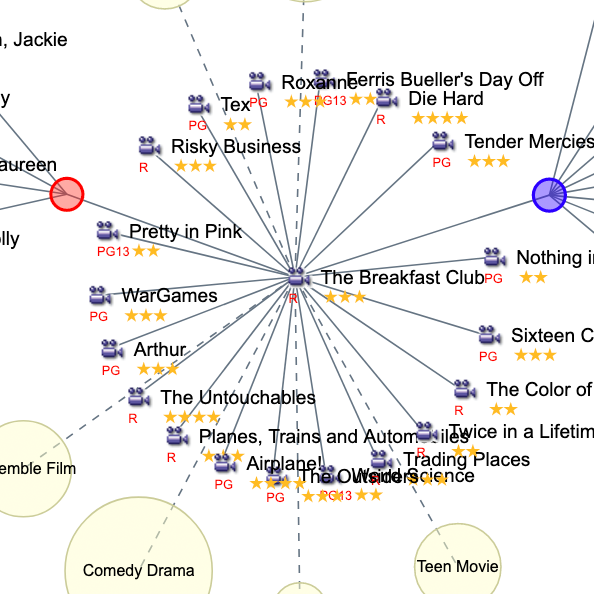
With Thinkmap, a developer can combine multiple Thinkmaps in one display. This visualization of the connections between actors, actresses, directors, movies, and genres, also includes a timeline that shows the release dates of any movies within the graph.
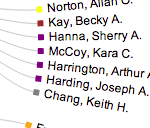
A Thinkmap organizational chart is a good way to show reporting structure within a company. Thinkmap's dynamic navigation lets the user focus on particular groups within the company, drilling down as necessary. In addition, the user sees a list of the programs that each person in the display is part of. The user can select any of these programs, and see which users are part of which program.
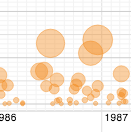
It is often useful to compare different properties of data in order to communicate how different variables relate. With Thinkmap's grid visualization, it's easy to compare two different properties on the x and y axis, and then to use size and color to help further differentiate items. This demonstration shows movies of the 80's, and allows the user to compare aspects such as movie gross, release date, and others.
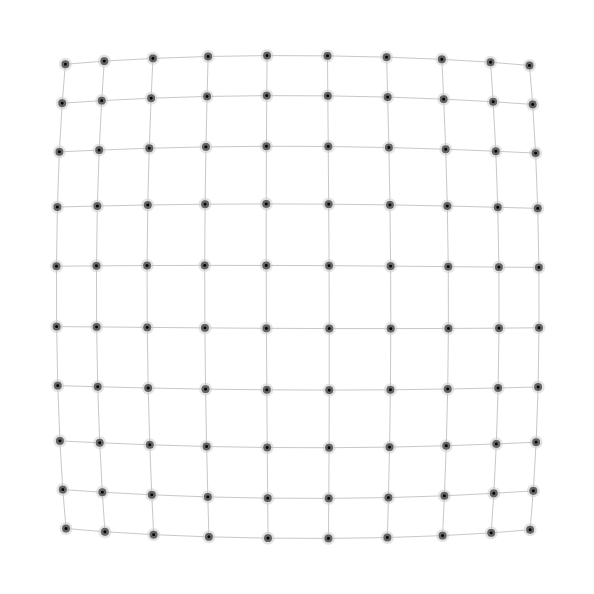
Get started by learning the basics of how to work with graphs and displays in Thinkmap. You'll build a simple flexible mesh that you can play with in your browser. To keep it simple, all the data in this tutorial is generated programmatically on the client side.
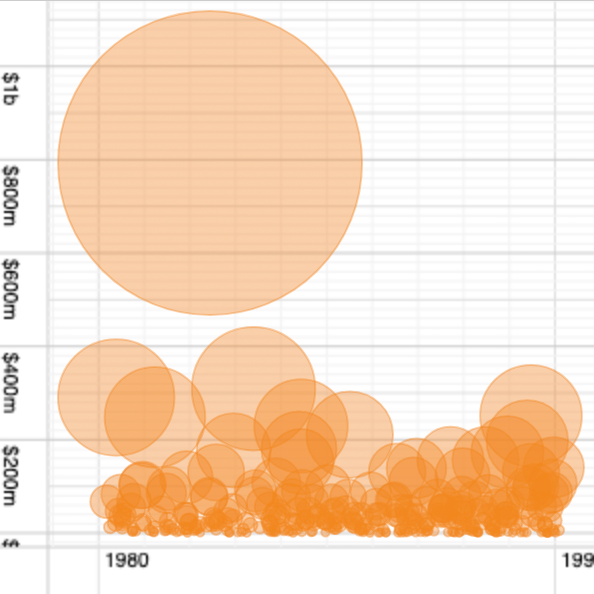
In this tutorial, you will learn the basics of how to show data using the grid layout. Using the sample Movies from the 1980's data set, you'll build a grid that allows you to compare movies by date, budget, box-office gross, rating and run time.
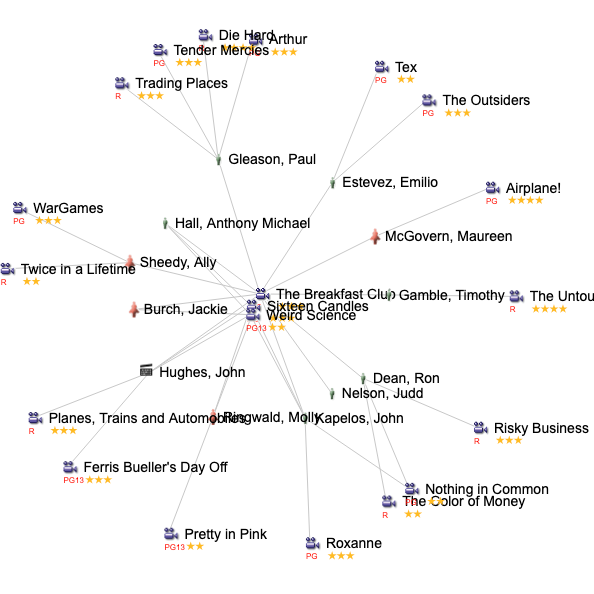
Learn how to load flat-file data from a CSV file into a Thinkmap graph on the client-side. Using a flat-file datasource on the client-side is a good practice when you have a small amount of data or are looking to rapidly prototype to see how a Thinkmap visualization will work.
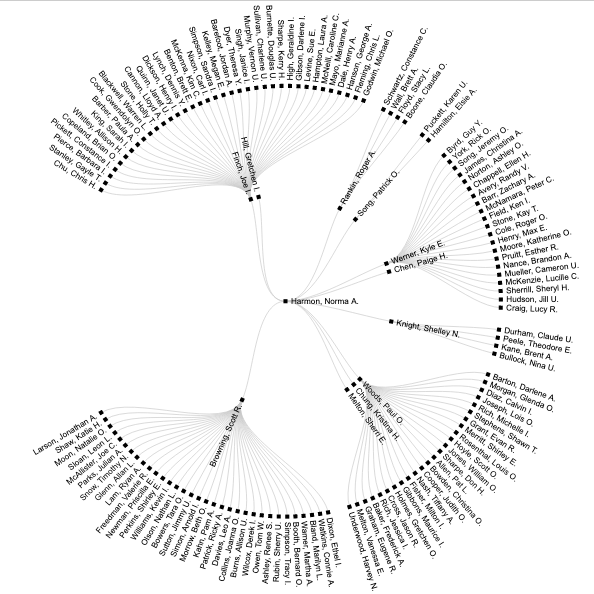
In this tutorial, we show how to set up a server-side flat-file datasource containing hierarchical data, and then visualize it as either as top-down, left-right or radial tree.
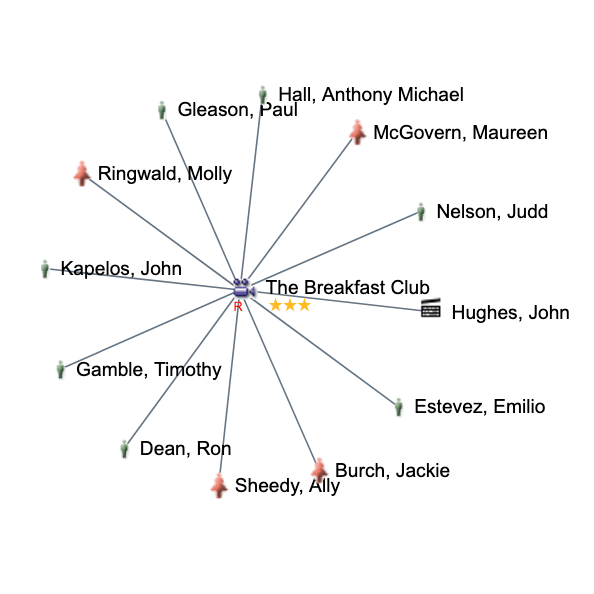
Learn how to manage history in Thinkmap and integrate it with the browser's back button. Save history for different types of graph actions, such as centering and expanding on entities, as well as layout changes and the current center selection.
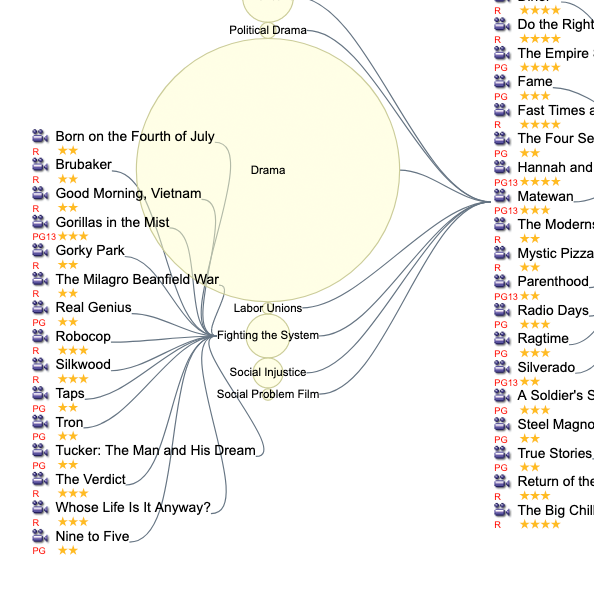
Learn how to let users explore further using the Expand Manager in Thinkmap to manage the incremental expansion and collapse of entities in a graph.
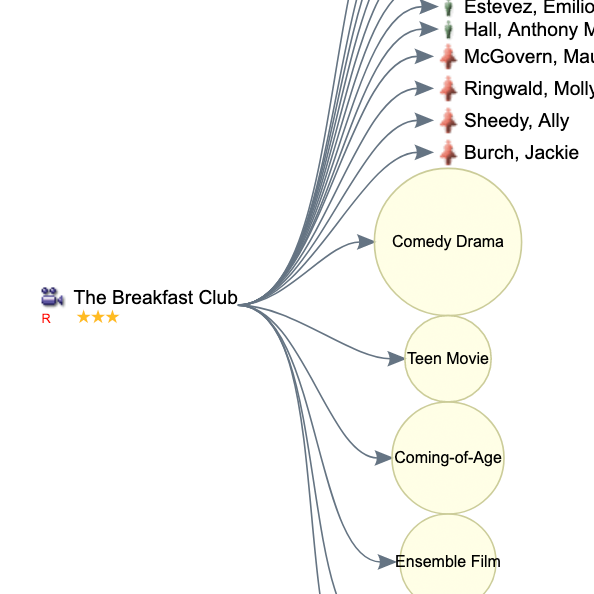
In this tutorial, you will learn the basics of how to change edge styles, anchors, and endpoints. Learn how to make curved edges, arrow endpoints, as well as control where edges meet nodes (anchors) on the screen.
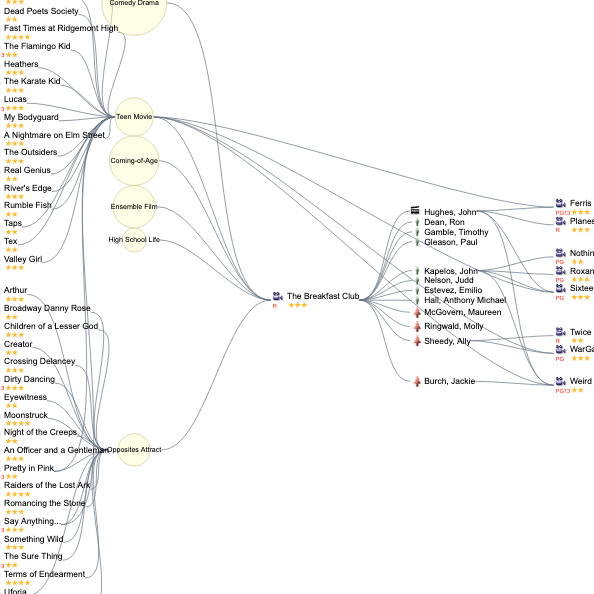
In this tutorial, you will learn the difference between trees and graphs, and how they can be used together in Thinkmap.
In this advanced tutorial, learn how to use custom SQL queries on the server side and cache invalidation on the client side to reduce the amount of data served to the client and ensure that you are visualizing the most up-to-date data.
In this advanced tutorial, learn how to use the $replace operator in Thinkmap's graph query language to group and remove relationships in order to create different views of your data.
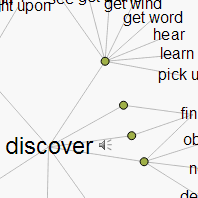
The Visual Thesaurus is an interactive reference tool, powered by Thinkmap, that gets students of all ages excited about words. Using our visualization technology, the Visual Thesaurus takes a unique, and remarkably beautiful, approach to presenting the results of a word lookup.