
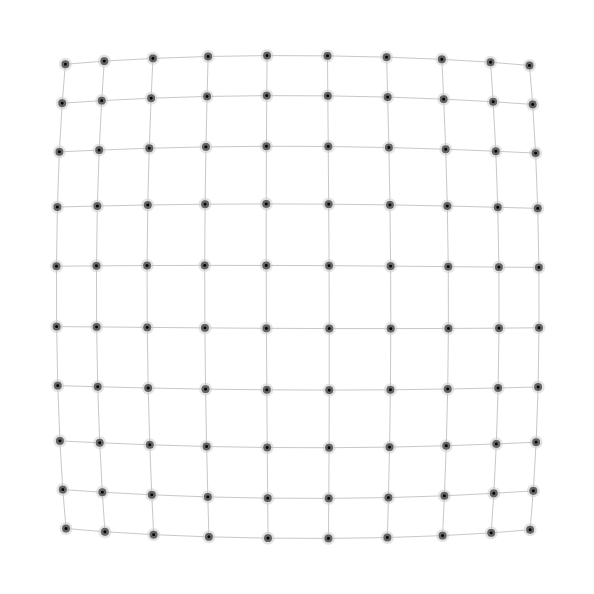
Get started by learning the basics of how to work with graphs and displays in Thinkmap. You'll build a simple flexible mesh that you can play with in your browser. To keep it simple, all the data in this tutorial is generated programmatically on the client side.
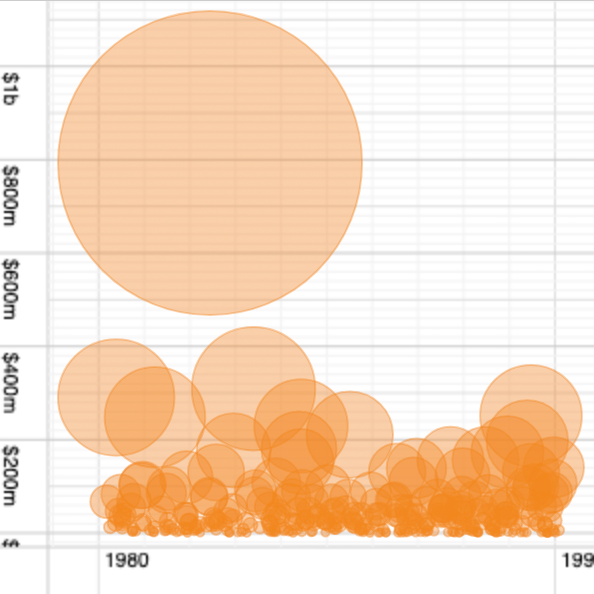
In this tutorial, you will learn the basics of how to show data using the grid layout. Using the sample Movies from the 1980's data set, you'll build a grid that allows you to compare movies by date, budget, box-office gross, rating and run time.
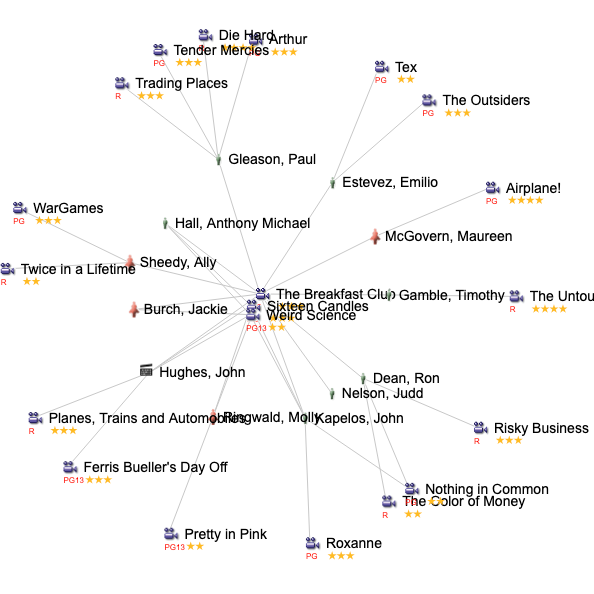
Learn how to load flat-file data from a CSV file into a Thinkmap graph on the client-side. Using a flat-file datasource on the client-side is a good practice when you have a small amount of data or are looking to rapidly prototype to see how a Thinkmap visualization will work.
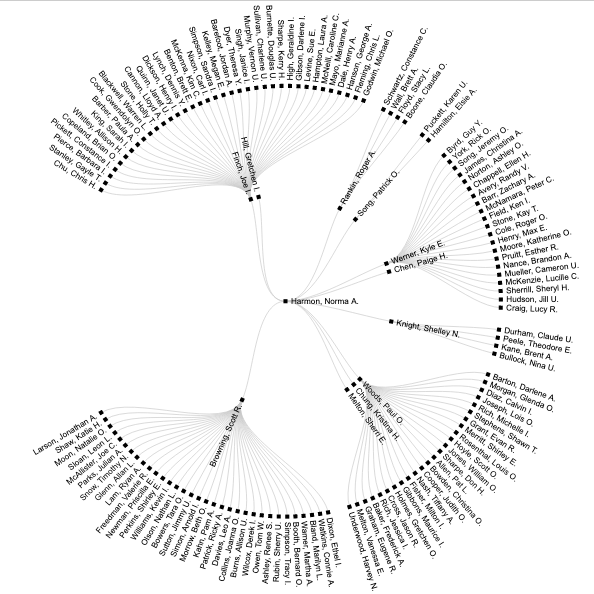
In this tutorial, we show how to set up a server-side flat-file datasource containing hierarchical data, and then visualize it as either as top-down, left-right or radial tree.
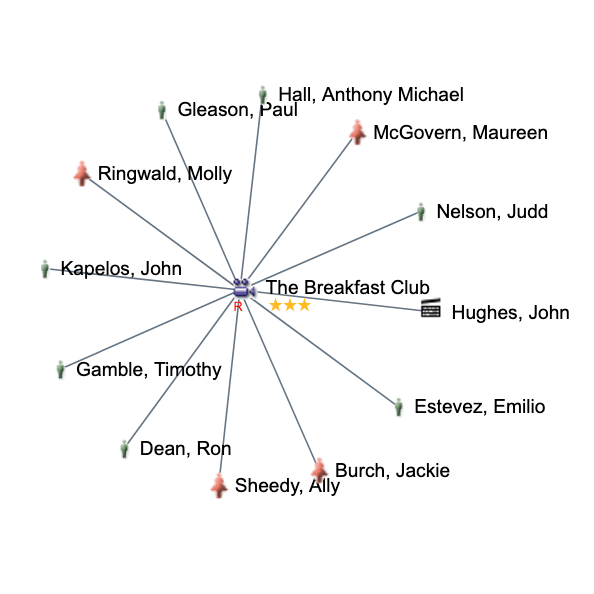
Learn how to manage history in Thinkmap and integrate it with the browser's back button. Save history for different types of graph actions, such as centering and expanding on entities, as well as layout changes and the current center selection.
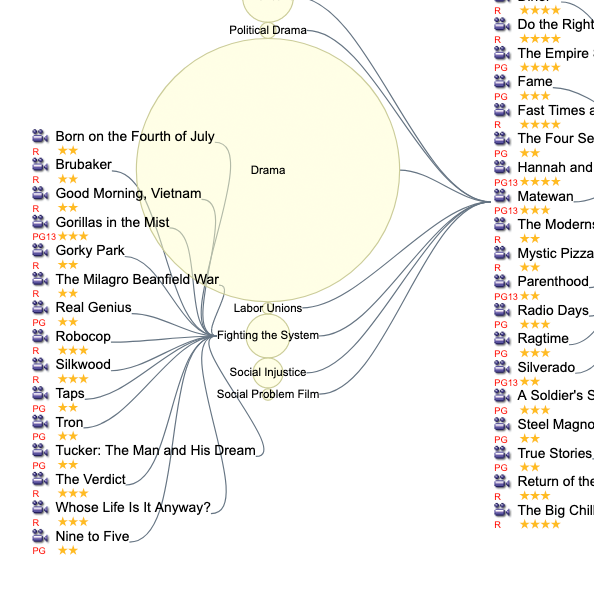
Learn how to let users explore further using the Expand Manager in Thinkmap to manage the incremental expansion and collapse of entities in a graph.
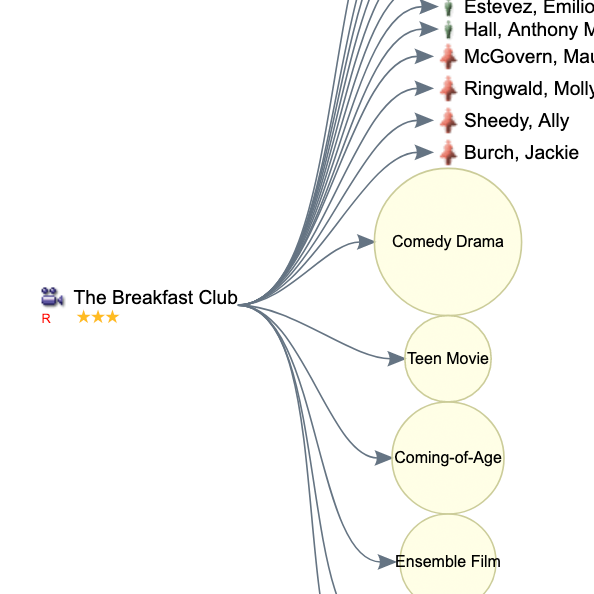
In this tutorial, you will learn the basics of how to change edge styles, anchors, and endpoints. Learn how to make curved edges, arrow endpoints, as well as control where edges meet nodes (anchors) on the screen.
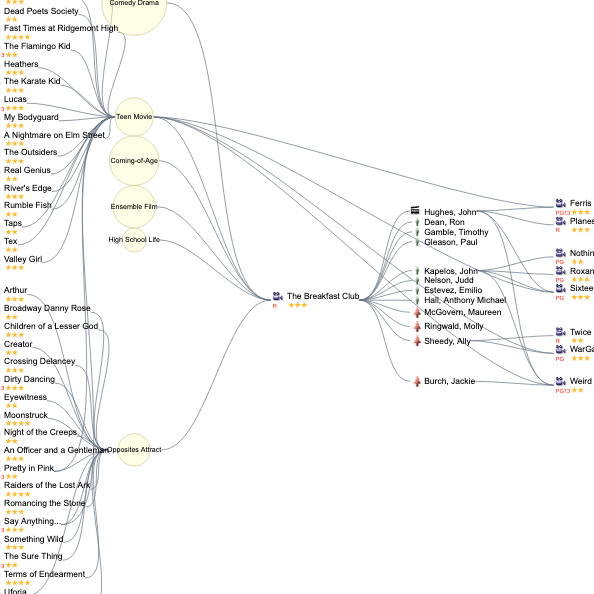
In this tutorial, you will learn the difference between trees and graphs, and how they can be used together in Thinkmap.
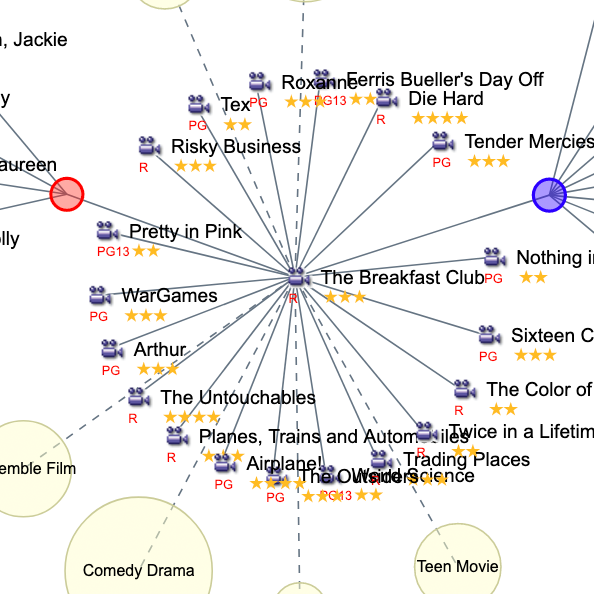
In this advanced tutorial, learn how to use the $replace operator in Thinkmap's graph query language to group and remove relationships in order to create different views of your data.